Adding Log Graphs and Queries to Dashboards in VCF Operations for Logs 9.1
Updated: Jul 20
In previous versions of VCF Operations for Logs (AKA Log Insight) you were easily able to add graphs and queries to a dashboard. In VCF Operations for Logs 9.1, this process is quite a bit different. This blog will walk you through the process to add a log widget to your dashboard. In order to do so, you have to go into Operate > Dashboards > Create.

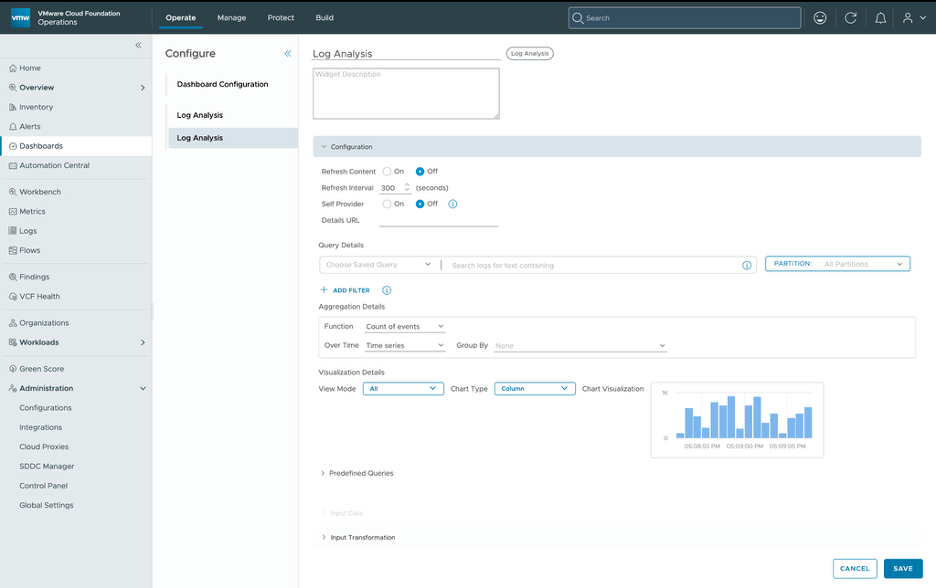
You will see a widget called Log Analysis.
Once you drag and drop the widget into the dashboard, you can click the pencil icon in the top right to edit the widget itself. We can edit the query details and graph format to filter for only the relevant logs events.
Useful Reminder: once you save the dashboard, you can click the three dots and two lines icon in the top right corner to share the dashboard:

Alternatively, we can share this dashboard with other members of our team by adding it to a report and publishing it on a reoccurring basis. To do so go to Operate > Dashboards > Reports and then click Add.

The logs dashboard we just created will be available as Report content when you click toggle from Views to Dashboards. Please note: at this point their is not a way to generate log Views to add to a report. The log reporting content is limtied to dashboards. Hope this helps!


Comments